
Operate tells you what's routed and shows you a live preview. Diagnostics tells you how well every connection is actually doing — the page to open when a show is degraded and you need to know exactly where.
Every source and destination endpoint appears as one row, grouped under its own name — a source's Ingest and Return rows together, a destination's Slot 1-3 and Program-out rows together — instead of scattered across the page in whatever order they happened to connect.
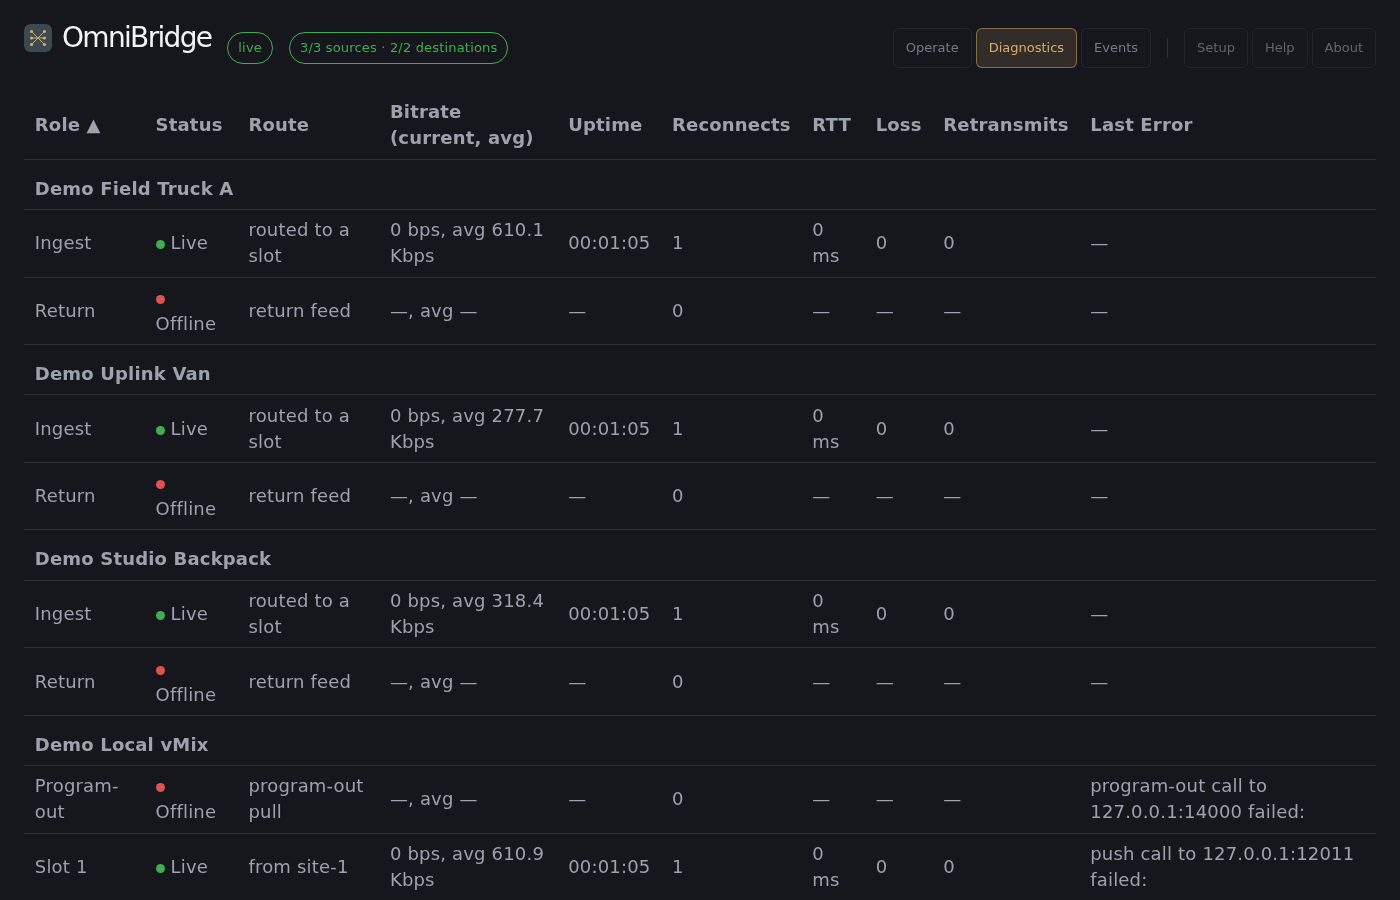
| Column | What it means |
|---|---|
| Role | Ingest / Return / Slot N / Program-out — click the header to sort within each group. |
| Status | The same red/yellow/green dot Operate's tally-light borders use — see Ports and Troubleshooting for the full color legend. Return and Program-out rows are two-state (red/green) only; there's no "routed" concept for those. |
| Route | What's currently patched in. A Slot row shows what's feeding it (or "not routed"); a Return row always shows "return feed"; a Program-out row always shows "program-out pull" — these last two aren't separate concepts, just how the Route column labels those two row types, since neither one takes a manually-picked route the way a slot does. |
| Bitrate | Current (last ~1s) and session-average — resets to zero on every reconnect. |
| Uptime | Time since the current connection came up. Blank ("—") while offline. |
| Reconnects | How many times this endpoint has connected since the gateway last restarted (or since the source/destination was deleted and re-added — a fresh source never inherits a deleted one's history, even if it reuses the same slot). |
| RTT / Loss / Retransmits | Real numbers for a native SRT connection. Shows "—" (not a fake 0) for anything ffmpeg-bridges (RTMP, RIST) or plain UDP-TS — there's no equivalent measurement available for those paths. Don't read "—" as zero loss; it means "not measured," not "measured, perfect." |
| Last Error | The most recent connection-level failure (bind failed, dial failed, listener error) with a timestamp available on click-to-expand. Cleared only by a new connection or a new error, not by time. |
Click anywhere on a row to expand it — shows exact last-connected/last-disconnected/last-error timestamps and raw byte/packet totals, useful for correlating "when did this actually drop" against your own show notes or a recording timeline.
Click any sortable column header to reorder rows within their group (sorting doesn't break groups apart) — useful for scanning "which of my sources has the worst loss right now" across everything at once.
There's no separate topology diagram in the dashboard today — the Operate and Diagnostics views together are the signal-flow picture. Here's how to read it:
 Field encoder                    Gateway (this app)                Local network
┌───────────────┐   SRT/RTMP/    ┌──────────────────────┐   SRT    ┌──────────────┐
│ OBS / vMix /   │ ─────────────▶│  Source (ingest)      │ ────────▶│ Destination   │
│ hardware       │  RIST/UDP-TS   │                        │  push    │ slot 1/2/3    │
│ encoder        │                │                        │          │ (vMix/OBS)    │
└───────────────┘                └──────────────────────┘          └──────────────┘
        ▲                                    │                              │
        │        SRT (return feed)           │                              │
        └────────────────────────────────────┘                              │
                 optional — a destination's Program-out                     │
                 routed back to the field for preview/                      │
                 confidence monitoring                                      │
                                                                             │
                                            Program-out ◀────────────────────┘
                                        (can feed another
                                         destination's slot,
                                         chained routing)
Every arrow above is a real, independently-tracked connection with its own row in Diagnostics — the gateway always dials out to destinations and listens for sources to dial in, which is why a destination going offline overnight never breaks anything (the gateway just keeps retrying) but a source's field encoder losing power means that source alone goes red, nothing else.
A destination's own routed-in source can itself be another destination's Program-out — useful for a downstream mixer/router picking up an upstream destination's feed. The gateway rejects any route that would loop back on itself, directly or through a longer chain.
Concrete example: say "Studio A" (a vMix box) is mixing several cameras, and "Studio B" (a second vMix box downstream) needs to pick up Studio A's finished program as one of its own inputs. Every vMix/OBS destination's program-out shows up as its own tile in the Sources section (labeled e.g. "Studio A program out") alongside your actual field sources — drag that tile onto one of Studio B's slot tiles, exactly like routing any field source onto a slot. Studio B's slot now shows Studio A's program-out as its live thumbnail and status.