| What | Port | Direction | Notes |
|---|---|---|---|
| Web dashboard | 8080 | Inbound to gateway | Your browser connects here |
| Source ingest (SRT/RTMP/UDP-TS/RIST) | 5000 + N | Inbound to gateway, from the field | Shown on each source's card |
| Return feed (all sources, shared) | 5000 | Inbound to gateway, from the field | One shared port, sources tell themselves apart by a stream ID — nothing you need to configure |
| vMix/OBS destination slots | 12000 + (N × 10) + slot (e.g. the first destination's 3 slots are 12011/12012/12013) | Outbound from gateway, to your local network | Shown on each destination's card |
| vMix/OBS destination program-out | 14000 (fixed) | Outbound from gateway | Same port on every vMix/OBS destination, always — not overridable from the dashboard (two destinations sharing one physical host will collide; see below) |
| Single-feed destination (Epiphan/RTMP/RIST) | whatever you set | Outbound from gateway | You choose this when adding the destination |
What N means, and whether it's stable: each source and each
destination gets a slot number the first time you add it (1st added =
1, 2nd = 2, and so on), and that number — and therefore its port —
never changes for as long as that entry exists. Deleting an entry frees
its number for reuse; the next new source/destination you add takes
the lowest free number, which could be one a deleted entry used to
have. So: your existing sources/destinations never have their ports
move out from under them, but a brand-new one can land on a port a
previous, now-deleted one used to occupy — worth knowing if you keep
your own notes on which physical encoder uses which port.
Key thing to remember: sources always call in to the gateway (so the gateway's public-facing firewall needs those inbound rules); everything on the destination side, the gateway always calls out — nothing on your local vMix/OBS network needs an inbound rule from the internet, only from the gateway itself.
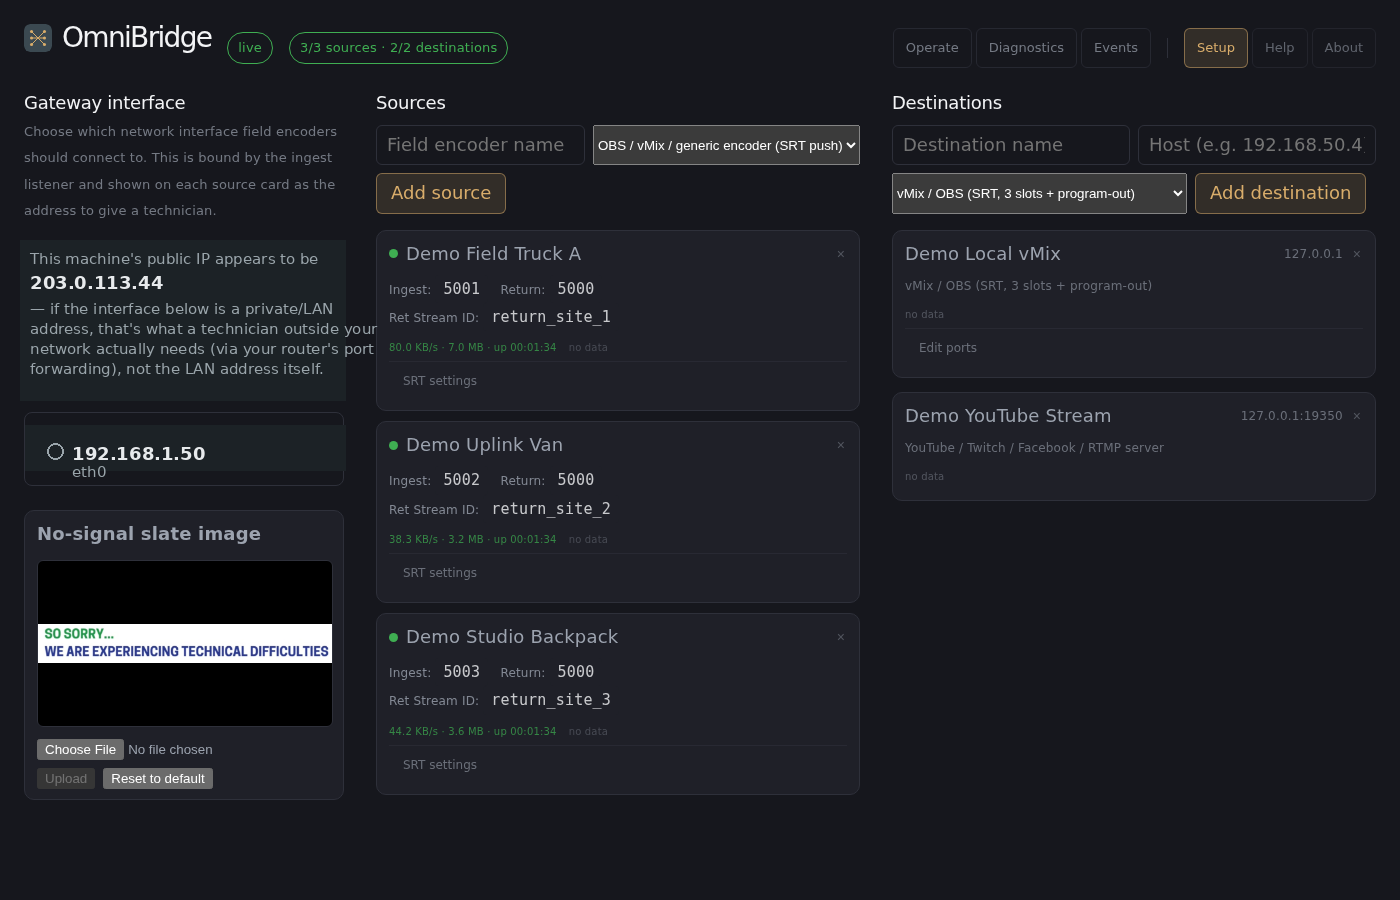
Which IP those inbound ports actually listen on is picked in the Setup tab's "Gateway interface" column — one network interface, chosen from a list of what's actually detected on the machine (never a freehand IP entry, so a typo can't wedge ingest onto an address that doesn't exist):
One NIC or two? For N sources and D destinations (each destination has 3 slots), every routed stream's bytes pass through the gateway once per hop: ingest = N, slot push = D×3, program-out pull = D×1, and — only if you're using return feeds back to the field — up to N more. A single NIC carries all of it. If you have two network interfaces available, splitting onto both instead (one dedicated to internet-facing source/return traffic, one dedicated to your local vMix/OBS network, picked independently as each destination's own interface) isolates internet jitter/loss from local production traffic and roughly halves what either interface has to carry. Using 6 Mbps as a reference 1080p60 SRT contribution bitrate:
| Scale | Single NIC (no return feeds) | Single NIC (return feeds active) | Internet-facing NIC | Local-network NIC |
|---|---|---|---|---|
| 3 sources, 1 destination | 42 Mbps | 60 Mbps | 36 Mbps | 24 Mbps |
| 8 sources, 3 destinations | 120 Mbps | 168 Mbps | 96 Mbps | 72 Mbps |
A single 1 Gbps NIC stays comfortably headroomed up to roughly 60 sources and 3 destinations with return feeds active — well past most real deployments. Past that scale, or at a much higher per-source bitrate, splitting across two 1 Gbps interfaces raises the practical ceiling substantially before faster hardware is actually necessary.
Every dot reflects a live connection right now, never a cached or saved state. On the Operate tab, this same red/yellow/green signal is shown as a colored border around each tile (a "tally light") instead of a small dot — same three states, same meaning, just more visible at a glance across a busy matrix. The Diagnostics tab shows the same red/yellow/green as a colored dot in its Status column, grouped by source/destination name instead of laid out spatially — see Diagnostics and Signal Flow for what else that view adds beyond just status.
A destination on UDP MPEG-TS doesn't have real connection state (UDP has no handshake) — its dot reflects whether a packet has arrived in the last 2 seconds, not a true connected/disconnected signal. Not configurable.
A source or destination on RTMP/RIST is bridged through an external
tool (ffmpeg) rather than handled directly — its dot reflects whether
that bridge process is currently running, which is slightly coarser
than SRT/UDP's precise per-packet tracking: it can't always distinguish
"waiting for a connection" from "actively receiving."
Next to the status dot on each source, destination slot, and program-out, you'll see a small traffic stat — bytes transferred, a live bitrate, uptime since the current connection started, and (from the Diagnostics tab) reconnect count and, for native SRT connections, real RTT/packet loss/retransmit numbers. This is the thing that actually proves media is flowing, since a green dot only means a connection is open, not that valid data is coming through it. If a dot is green but the traffic stat stays at 0 B, something upstream is connected but not actually sending — check the encoder's own output status, not the gateway.
Traffic counters exist for every native SRT/UDP relay (source ingest,
vMix/OBS destination slots, program-out, the return feed); RTT/packet
loss/retransmits specifically only exist for native SRT (not plain
UDP-TS) — see Diagnostics and Signal Flow
for the full column reference. None of the above exists for single-feed
(Epiphan/RTMP/RIST) destinations, which don't have per-packet
visibility into the ffmpeg bridge.
Every source and station-program-out tile on Operate shows an actual preview frame from its incoming video, refreshed roughly every 5 seconds — not just a status color. This is the fastest way to confirm "is this actually the right camera/feed," not just "is something connected." A tile that's been green for a while but still shows "no preview" usually means the connection itself is fine but the source isn't sending decodable video yet (e.g. an encoder that connected before it started actually encoding).
Two things worth knowing:
ffmpeg
bridge feeding them.If a feed has nothing real to send for 5 seconds, the gateway automatically shows a "technical difficulties" slate instead of sending silence — and switches back to the real picture the instant it resumes, with no action needed from you.
Why this matters: a field decoder that receives nothing at all often just reports a plain "connection timed out," which looks exactly like a network problem even when the real cause is something mundane like "the station this return is fed from hasn't started streaming yet." The slate turns that into a clear, visible signal instead — if a field operator sees "technical difficulties" on their return monitor, that alone tells you the problem is on the gateway/production side, not the network.
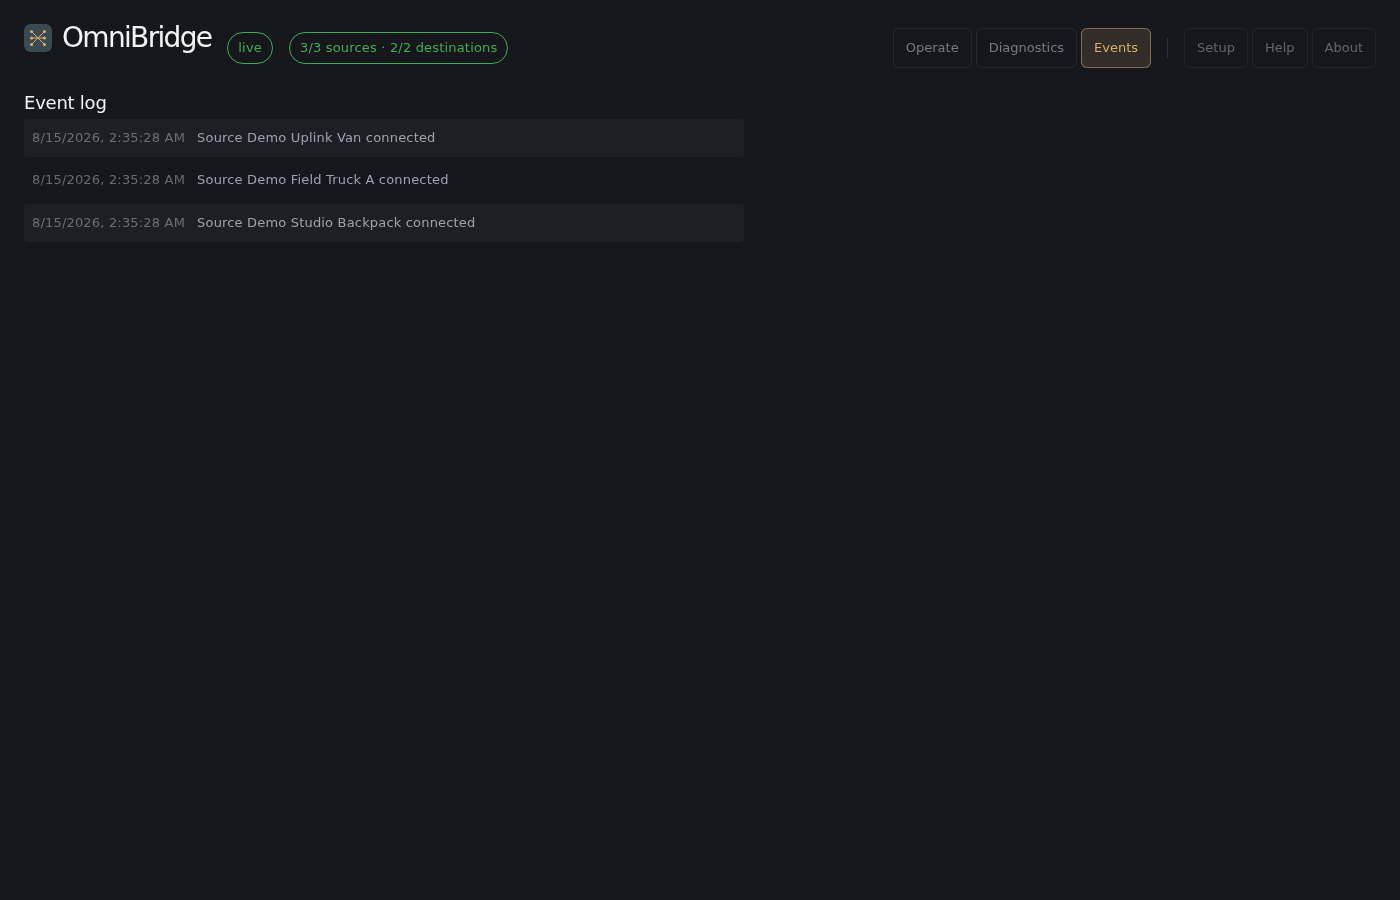
You can replace the slate image from the Setup tab — the "No-signal slate image" panel sits directly under the gateway interface picker, and shows a live preview of whatever's currently set so you're never uploading blind. Any common image format works, and it's automatically scaled to fit the screen without stretching, whatever its original shape. "Reset to default" restores the built-in one at any time.
Each source's return feed also gets its own live thumbnail now, shown right next to its return-routing control on the Operate tab — so you can see at a glance, right from the dashboard, whether a site is currently getting real content or the slate, without needing to check the field decoder itself.
This is a different thumbnail from a destination's own "Program Out" tile, and they behave differently on purpose:
So if a station goes down: its own Program Out tile goes blank (no change there), while any site whose return is fed from that station switches to showing the slate on its return thumbnail. Once the station's Program Out tile shows real content again, the return thumbnail should follow shortly after.
Click SRT settings on a source's card, or Edit ports on a vMix/OBS destination's card, to override the gateway's default SRT latency (120ms) or require a passphrase — only meaningful for SRT-protocol sources/destinations. If a passphrase is set and the other side doesn't present it, the connection is refused outright (not just flagged) — if a source or destination that used to connect suddenly can't, check whether someone set a passphrase here first, before digging into networking.
("SRT settings" and "Edit ports" are different labels for the same kind of thing — both open that card's endpoint configuration overrides, just named for what's most relevant on a source's card vs. a destination's.)
The return feed does not inherit a source's passphrase. A
source's SRT settings only protect that source's ingest — the shared
return-feed listener (port 5000, every source multiplexed through it)
has no per-source latency/passphrase of its own.
Source won't connect:
Destination won't connect:
14000) —
there's currently no dashboard control to override this per
destination. Two options: run the second one on a different host/VM,
or (power users) set program_out_port_override for one of the
destinations directly in app_config.json and restart the gateway —
it isn't exposed in the dashboard yet, but the backend already
supports it.Video connects but looks wrong / stutters:
Something changed and now nothing works: